Output is the amount of products produced per unit of working time or per one average employee or worker for a certain period (hour, shift, month, quarter, year). It is calculated as the ratio of the volume of produced products (OP) to the working time spent on the production of these products (T) or to the average number of employees or workers (H). Let's calculate this indicator over the years:
Let's calculate this indicator by year:
- 2009: 4241/236 = 19.97 thousand rubles/day
- 2010: 3986/236 = 16.89 thousand rubles/day
- 2011: 4193/236 =17.77 thousand rubles/day
The highest figures were demonstrated in 2009, then there was a decrease of 3.08 thousand rubles/day. By 2011, there was a trend towards an increase in the production rate of 0.98 thousand rubles/day, and at the time of the study, the daily output of all employees of the enterprise was 17.77 thousand rubles per day. V = OP/H
This indicator is also calculated over three years for ease of comparison:
- 2009: 4241/28 = 151.5 thousand rubles/person
- 2001: 3986/26 = 153.3 thousand rubles/person
- 2011: 4193/31 = 135.3 thousand rubles/person.
From the calculations we can conclude that the enterprise showed its highest output in 2010, when, with 26 people, the average annual output per employee was 153.3 thousand rubles. In 2011, the number of employees increased by 5 people, but their work efficiency decreased by 20 thousand rubles per person per year. This decrease is due to a decrease in personnel efficiency due to poor motivation and deteriorating working conditions. In 2011, the average annual output per employee was only 135.3 thousand rubles.
They also distinguish between average hourly, average daily, average monthly, average quarterly and average annual production.
Average hourly production rate (per hour):
Per hour = OP/T hour
where T hour is the number of man-hours worked.
To calculate this indicator, average data on the volume of production per day by one employee is taken. In most cases, workers work 8 hours. When calculating hourly output, man-hours worked do not include intra-shift downtime, so it most accurately characterizes the level of productivity of human labor. Calculation of average hourly output:
- 2009: 713/8 = 89,125 rubles/hour
- 2010: 649.6/8 = 81.2 rubles/hour
- 2011: 573/8 = 71.6 rubles/hour
Thus, there is an annual decline in the rate of average hourly production, which is an extremely negative trend.
The indicator of average daily production (in days) of products reflects the average volume of products produced by one worker per day worked and is calculated by the formula:
In days = OP/T days
T days - average number of days worked
This indicator is less accurate than hourly output, since when calculating daily output, the composition of man-days worked does not include all-day downtime and absenteeism. In this case, the numerator is the annual output of one employee, and the denominator is the average number of working days. Calculation of the indicator:
- 2009: 151.5/236 = 642 rubles.
- 2010: 153.3/236 = 649.6 rubles.
- 2011: 135.3/236 = 573.3 rubles.
It should be noted that in accordance with the decrease in the rate of average hourly production at the enterprise, the average daily output also decreased. This is an extremely negative trend; in 2011, there was a decrease in daily output per employee in the amount of 76.3 rubles. compared to the previous year.
If labor costs are measured by the average number of workers, then we obtain an indicator of the average monthly (average quarterly, average annual) production output per one average worker (depending on the time period to which the volume of production and the number of workers relate - month, quarter, year) by formula: B = OP/H
where OP is the volume of production (monthly, quarterly, annual) depending on the type of calculated output,
H - number of people for a given period.
Let's calculate the average monthly output:
- 2009: 353.42/28 = 12.62 thousand rubles/person
- 2010: 332.17/26 = 12.78 thousand rubles/person
- 2011: 349.42/31 = 11.27 thousand rubles/person.
Thus, we can conclude that the enterprise demonstrated its highest output in 2010, when, with 26 people, the average monthly output per employee was 12.78 thousand rubles. In 2011, the number of employees increased by 5 people, but their work efficiency decreased by 11.51 thousand rubles per person per month. As already noted, this decrease is due to a decrease in the efficiency of personnel due to poor motivation and deteriorating working conditions. In 2011, the average monthly output per employee was only 11.27 thousand rubles.
The labor force turnover coefficient for admission throughout the entire analyzed period exceeds the turnover coefficient for retirement, which indicates the adequacy of the renewal of labor resources.
The turnover rate does not exceed 1.3%, which indicates the effectiveness of management and social policy of the enterprise, and high labor discipline.
4.4. Analysis of the efficiency of use of labor resources
The efficiency of the use of labor in an enterprise characterizes labor productivity. For analysis purposes, a direct indicator of labor productivity is used: production and indicators of the use of working time. A general assessment of the dynamics of production makes it possible to determine its change in comparison with the actual indicators of the previous year. Calculations of output are summarized in table. 4.3.
Table 4.3
Labor productivity
|
Indicators |
Base | |||
|
1. Commercial products at comparable prices, thousand rubles. | ||||
|
2. Average number of staff members, people. | ||||
|
3. Average number of workers, people. | ||||
|
4. Share of workers in PPP | ||||
|
5. Number of days of work to produce products | ||||
|
6. Average working day, hour. | ||||
|
7. Average annual production of PPP, thousand rubles. (page 1 / page 2) | ||||
|
8. Average annual output of a worker, thousand rubles. (page 1 / page 3) | ||||
|
9. Average hourly output of a worker, thousand rubles. (p.8 / (p.5*p.6)) |
Table data 4.3 indicate a decrease in the efficiency of use of labor resources. Thus, in the reporting period, production of PPP decreased by 12.2%, at the same time, the decrease in worker output was 16.7%. This indicates ineffective management at the enterprise. The relationship between indicators of efficiency in the use of labor resources is presented in Fig. 4.1.
Fig.4.1. Relationship between indicators of labor resource use
Thus, the average annual output is influenced by four factors, which are assessed using the absolute difference method based on the data in Table. 4.2.:
- the impact of changes in the share of workers in the number of industrial workers
(0.0354) × 253 × 7.45 × 0.15605 = 10.4 thousand rubles.
- the impact of changing the number of days of work
0.699 × (3) × 7.45 × 0.16605 = 2.4 thousand rubles.
- the impact of changes in working hours
0.699 × 256 × (-0.25) × 0.15605 = -7 thousand rubles.
- the impact of changes in the average hourly output of a worker
0.699 × 256 × 7.2 × (-0.0231) = - 29.7 thousand rubles.
- joint influence of factors
10.4 + 2.4 – 7 – 29.7 = - 23.9 thousand rubles.
Thus, the main reason for the decrease in PPP production is the reduction in the worker’s hourly output. The reduction in working hours also had a negative impact. The positive impact of increasing worker share and increasing days worked was less significant.
As a result of the decrease in output, marketable products decreased. To calculate the influence of factors, the absolute difference method is used:
- the impact of changes in numbers
72 ×195.17 = 14046 thousand rubles.
- impact of changes in production
23.9 × 1677 = - 40089 thousand rubles.
Thus, the reduction in output contributed to a decrease in marketable output by 40 million rubles.
4.5. Analysis of the dynamics and structure of the wage fund
Analysis of the use of labor resources and the growth of labor productivity must be considered in close connection with wages. With the growth of labor productivity, real preconditions for increasing wages are created. Ideally, the rate of growth in wages should slightly lag behind the rate of growth in labor productivity. In practice, for one reason or another, there may be different situations.
The calculation of wage indicators is summarized in table. 4.4.
Table 4.4
|
Indicators | ||||
|
1. Average number of staff members, people | ||||
|
2. Average number of workers, people | ||||
|
3. Payroll fund PPP, thousand rubles. | ||||
|
4. Workers' compensation fund, thousand rubles. | ||||
|
5. Average monthly wages of workers, rub. | ||||
|
6. Average monthly salary of a PPP employee, rub. |
Analyzing the data summarized in table. 4.4. that there was a significant increase in all indicators of wages. Thus, the wage fund of the PPP increased in the reporting period by 30,643 thousand rubles. or by 43.9%. The workers' compensation fund increased at a less rapid pace (141.9%). As a result, the average wages of workers increased by 28.9%, while the same figure for PPP increased by 37.7%. This indicates a more significant increase in wages in other categories.
It should be noted that the increase in wages at the enterprise in the reporting period is accompanied by a decrease in output, which can be explained by an increase in the cost of living and the need to increase wages. This indicates non-compliance with the principles of organizing remuneration at the enterprise.
Questions for self-control
1. What indicators evaluate labor productivity at the beginning?
2. What is the basic principle of organizing remuneration in terms of
in the market economy?
Tests and situations
1. The efficiency of using labor resources at an enterprise is characterized by:
a) labor turnover rates;
b) labor productivity;
c) capital-labor ratio.
2. If an enterprise experiences an increase in labor productivity with a simultaneous decrease in average wages, its activities can be characterized as:
a) effective;
b) not effective;
c) socially oriented.
3. With a simultaneous increase in capital productivity and capital-labor ratio, labor productivity:
a) grows;
b) decreases;
c) does not change.
4. If at an enterprise an increase in labor productivity is accompanied by a decrease in revenue while the number remains unchanged, this may indicate:
a) about a decrease in product quality;
b) a reduction in demand for products and a reduction in prices;
c) on accelerating the turnover of finished products.
Chapter 5. ANALYSIS OF PRODUCTION COSTS
5.1. Objectives and sources of information for analysis
An important indicator characterizing the operation of an enterprise is the cost of production. The financial results of enterprises, the rate of expanded reproduction, and the financial condition of an economic entity depend on its level.
The cost of production is a valuation of the production resources, raw materials, supplies, fuel, energy, fixed assets, labor resources, and other costs used in the production process.
Analysis of the cost of products, works and services is of exceptional importance. It allows you to find out trends in changes in this indicator, the implementation of the plan at its level, determine the influence of factors on its growth and, on this basis, assess the enterprise’s performance in using opportunities and establish reserves for reducing production costs.
The objectives of product cost analysis are:
General assessment of the implementation of the cost reduction plan;
Investigation of the reasons for deviations from the plan;
Study of the structure and dynamics of costs by economic elements
Identification of on-farm cost reduction reserves.
The sources of information for the analysis are the statistical reporting form “Report on the costs of production and sales of products (works, services)”, planned and reported calculations of product costs.
5.2. Estimation of cost indicators
For analysis purposes, the following cost indicators are used:
The total cost of commercial products is the total cost of living and embodied labor for the entire volume of commercial products;
The cost of a unit of production is the specific cost of production and sales of a unit of homogeneous products;
Costs per ruble of commercial products are the specific costs of producing a unit of heterogeneous products in value terms.
Costs per ruble of commercial products are a general indicator characterizing the cost and level of profitability of products. It provides a link between costs and profits, allows you to assess the dynamics of costs, and analyze the influence of factors. The results of the analysis of cost dynamics are summarized in table. 5.1.
Table 5.1
Dynamics of costs per ruble of commercial products
|
Indicators | ||||
|
1. Commercial products, thousand rubles. | ||||
|
2. Product cost, thousand rubles. | ||||
|
3. Costs per ruble of marketable products, kopecks. |
As can be seen from table. 5.1, the growth in production volume in value terms is accompanied by an increase in production costs, and the growth rate of costs exceeds the growth rate of production. As a result, there is an increase in costs per ruble of commercial products from 69.9 to 82.9 kopecks. This indicates a significant decrease in the efficiency of the enterprise. In the reporting period, the enterprise received significantly less profit per ruble of marketable products - 17.1 kopecks, while in the base period - 30.1 kopecks / ruble.
5.3. Cost structure by economic elements
The structure of production costs is analyzed in two main complementary directions according to cost elements and according to costing items. When analyzing production cost estimates, the proportion in which total costs are distributed between objects of labor, means of labor and payment of living labor is established. All costs are reflected in the cost estimate, regardless of where the costs arise. The costs that form the cost of production include:
Material costs (raw materials, supplies, purchased components and semi-finished products, fuel, electricity, heat);
Labor costs;
Depreciation of fixed assets;
Other costs (depreciation of intangible assets, rent, mandatory insurance payments, interest on bank loans, taxes included in the cost of production, contributions to extra-budgetary funds, etc.)
Analysis of the cost structure by economic elements allows us to assess the level of material, labor and depreciation costs for production.
Data for analysis are summarized in table. 5.2.
Table 5.2
Cost structure by element
|
Name of elements |
Total, thousand rubles |
Structure, % |
Deviation |
|||
|
Material costs | ||||||
|
Labor costs | ||||||
|
Contributions for social needs | ||||||
|
Depreciation of fixed assets | ||||||
|
Other costs | ||||||
|
Full cost |
As can be seen from table. 5.2, the total cost increased in the reporting period by 23.1% or 50,465 thousand rubles. The main reason for this growth was an increase in material costs due to rising prices for raw materials and an increase in production volumes. At the same time, despite the increase in the share of material costs in the structure from 18.3 and 33.0%, the largest share is occupied by labor costs, that is, production is labor-intensive.
The reduction in other costs is positive, which indicates a reduction in the costs of managing the organization.
According to the table. 5.2 evaluate the dynamics of various elements of costs per ruble of marketable products and type of production. The calculations are summarized in table. 5.3.
As follows from the data in table. 5.3., per ruble of marketable products, the enterprise needs to make 27.4 kopecks. material costs, 30.9 kopecks. labor costs and 2.9 kopecks. costs of fixed assets. Moreover, in dynamics the material intensity of production increases most significantly.
Table 5.3
Dynamics of unit cost indicators
|
Indicators | |||
|
1.Material consumption, kopecks. | |||
|
2. Salary intensity, kopecks. | |||
|
3. Depreciation capacity, kopecks. |
The increase was 14.6 kopecks. To reduce costs, strict control over compliance with consumption standards for raw materials and materials, especially electricity, is required, as well as the search for new markets and suppliers of raw materials and materials.
5.4. Factor cost analysis
To assess the reasons for changes in costs, factor analysis methods are used. The change in the level of costs per ruble of marketable products is directly influenced by product output in physical terms, the cost of a unit of production in physical terms and the price per unit of production. To assess the influence of factors, the calculation of conditional indicators of costs per ruble of products is carried out, the data for which are summarized in table. 5.4.
Table 5.4
Factor cost analysis indicators
|
Product type |
Product output, thousand tons. |
Cost, rub./t |
Price, rub./t |
Costs at base cost, thousand rubles. |
Commercial products at base prices, thousand rubles. |
|||
The calculation of the influence of factors is summarized in table. 5.5.
What questions will you find answers to in this article:
The only objective criterion by which one can evaluate labor productivity at an enterprise is the competitiveness of the product on the market. Therefore, comparing productivity indicators (such as production volume divided by the number of employees) in different companies, in my opinion, is incorrect. The comparison results will vary greatly depending on what is in the numerator of the fraction: price, weight, standard hour, added value or some other parameter.
I worked for almost 20 years in senior positions in various companies in Belarus and Russia, took part in consulting projects at dozens of different industries - and here are the conclusions regarding increasing labor productivity that I have formulated.
Conclusion 1. In order for an enterprise to constantly develop, labor productivity must grow at a higher rate than wages. There are two ways to achieve this.
- To complicate the manufactured product, abandoning relatively simple technologically products that have a low cost per unit weight, in favor of more complex ones, the cost per unit weight of which is higher. Various versions of this approach are applicable to any enterprise.
- Use more productive equipment. This method is economically feasible only subject to serial production and only when certain production volumes are achieved.
Conclusion 2. Each company must develop measures to increase labor productivity independently; Moreover, different workshops of the same plant will require different methods. For example, at the BelAZ production association, the development of such approaches was carried out by a special laboratory for the scientific organization of labor. To increase efficiency and productivity, they first centrally improved standardization and control of deviations from the norm. Any newly introduced incentives for more intensive work were based on calculated standards, and the share of the variable part in wages did not exceed 30%. In the smaller plant that I now manage, we achieve the same goals by stimulating the search for productivity improvements in each workplace; At the same time, the variable part of the salary is more than 60%. It cannot be said that one of these options is better than the other, but I would not recommend swapping them, introducing the first in an enterprise like mine, and the second in a company like BelAZ.
What affects labor productivity
1. Mass and serial orders. Large production volumes justify the use of expensive, but highly productive equipment and allow detailed rationing of production.
2. Innovative nature of the product.
3. Production planning horizon. The longer the period for which plans are drawn up, the more precise and rhythmic the production process can be made.
4. Availability of long-term and cheap loans or long-term investments.
5. The degree of automation of the collection of accounting information in production.
6. Increasing production volumes while maintaining the number of personnel due to diversification of production and production of technologically more complex products.
7. Carrying out measures to stimulate the intensification of the work of each employee (primarily the preparation and adoption of appropriate bonus provisions).
It is obvious that the manager of a particular enterprise cannot influence the first four factors, which are especially important for increasing labor productivity: the most significant conditions are determined by the quality of the government policy pursued. So, when our directors are criticized for the low efficiency of the companies entrusted to them, this is not always the right criticism.
However, in a free market, CEOs can drive productivity growth through the last three factors. This may be enough to achieve a beneficial effect - even in seemingly hopeless situations. A good example is the positive dynamics of the development of our enterprise. Just 10 years ago it had negative net assets and was under external management. And today, with practically the same number of personnel, the volume of production in value terms has increased more than 11 times, and the average salary has increased slightly more than five times. At the same time, the value output per worker increased almost 11 times, while physical output (measured in tons per person), on the contrary, fell by almost half due to the complication of the manufactured product (see figure). The fastest way to influence the situation is by introducing new remuneration schemes. I will dwell on this method in a little more detail.
Click on the picture to enlarge it
Increase productivity through premium payment schemes
Each compensation scheme is effective only as long as productivity indicators continue to increase. This is why it is so important not to miss the moment when growth ends: this will be a signal for you that the existing reserves for increasing efficiency have been exhausted and you need to look for new ones. I have developed motivation systems for hundreds of work teams, and my experience allows me to say: if you find the right solution, within two months you will achieve a tangible positive result. I’ll tell you what system has been used at our enterprise for the last two years to calculate bonuses for workers in the mechanical assembly shop.
So, when calculating, we use the following indicators.
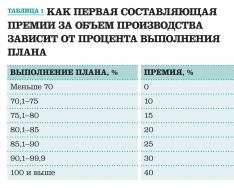
1. Implementation of the workshop plan. The basic (normal) value of the reward for achieving this indicator is 60% (there is no upper limit on the amount of the bonus - we use a flexible approach). The final value depends, firstly, on the percentage of fulfillment of the production plan (see Table 1), and secondly, on two coefficients.
- K1 – the ratio of the output of commercial products (in rubles) to the base indicator equal to 80 million rubles. per month. The introduction of K1 encourages shop workers to find reserves when making difficult plans and insures against paying too high salaries in case of low workload.
- K2 – the ratio of the base number of employees (35 people) to the actual number. The presence of K2 in the calculation scheme keeps the workshop management from attracting an excessive number of workers to fulfill the plan - after all, if the number exceeds the base one, the coefficient will be less than one and the total bonus amount will decrease. I assure you: now, without an objective need for additional personnel, applications for hiring new employees from the workshop are never received.
As can be seen from Table 1, the first part of the bonus for production volume when the plan is fulfilled by 70–100% ranges from 0 to 40%. A flexible scale allows you to maintain a focus on results, even if the planned indicators seem unattainable. The second term of this premium is calculated using the formula 20% × K1 × K2. Examples of calculating premiums for production volume for various input data are given in Table. 2.
2. Product quality. The basic reward for providing this parameter is 30%. The specific amount of payment is influenced, firstly, by indicators of compliance with the technological process, ascertained during internal control, and secondly, by the number of registered claims received from customers. Thus, this component of the bonus is not related to labor productivity - and therefore I will not dwell on it in detail here.


The introduction of innovative measures to improve production efficiency reduces the cost of working time per unit of production.
By multiplying the savings in labor time per unit of production and the total output for the year, we obtain the savings in man-hours, i.e. reducing the labor intensity of products. By dividing this value by the nominal working time of one worker, we calculate the relative release of the number of industrial production personnel.
An increase in labor productivity is qualitatively determined through the relative labor savings according to the formula
?PT =,
where?PT - increase in labor productivity,%; CR - the initial (calculated) number of production staff, calculated taking into account the planned or actual volume of production based on the actual output of the base period, people; Echr - reduction (release) of the number of industrial workers as a result of the action of factors increasing labor productivity, people.
An assessment of the implementation of the plan for increasing labor productivity, taking into account relative labor savings, is presented in Table. 11.3.
Table 11.3. Implementation of the labor productivity plan by one worker
| № | Indicators | Last year | Reporting year | Implementation of a plan, % | Absolute increase compared |
||||
| according to plan | />actually | with the previous year | with a plan | nbsp; | |||||
| according to plan | actually | nbsp; | |||||||
| 1 | Cost of products accepted when calculating average output, thousand rubles | 61 321 | 64 095 | 64 595 | 100,8 | 2774 | 3274 | +500 | nbsp; |
| 2 | Average number of staff members, people. | 5791 | 5800 | 5789 | 99,8 | +9 | -2 | -11 | nbsp; |
| 3 | Average annual production per one operating production plant (page 1 / page 2), rub. | 10 589 | 11 051 | 11 158 | 101 | 462 | 569 | +107 | nbsp; |
| 4 | Estimated (initial) number of PPP*, people. | 6053 (64 095 / / 10 589) | 6100 (64 555 / / 10 589) | nbsp; | |||||
| 5 | Savings in PPP personnel, people. (page 4 - page 2) | - | 253 (6053 - - 5800) | 311 (6100 - - 5789) | nbsp; | ||||
| 6 | Growth in labor productivity (LP) (page 1 / page 2 100),% | 100 | 104,4 | 105,4 | nbsp; | ||||
| 7 | Increase in labor productivity (LP) (page 6 - 100), % | - | 4,4 | 5,4 | nbsp; | ||||
| 8 | Implementation of the labor productivity improvement plan, % | - | - | 101,0 (105,4 / / 104,4) 100 | nbsp; | ||||
*Determined by dividing the volume of production by the previous year’s output
The total relative decrease[*] (-), increase (+) in the number of industrial production personnel amounted to:
| According to plan | Actually | |
| Total | -253 | -311 |
| Including by increasing the technical level of production | -231 | -186 |
| Of these, due to: | ||
| commissioning of new equipment | -183 | -127 |
| equipment modernization | -28 | -25 |
| improving technology | -20 | -34 |
| changes in the structure of products | -54 | -124 |
| changes in natural conditions | +160 | +256 |
| -128 | -257 | |
| Of these, due to: | ||
| expansion of service areas | -17 | -17 |
| changes in the share of cooperative supplies | +67 | -134 |
| reducing absenteeism | -114 | -106 |
| reduction of intra-shift downtime | -64 | - |
Evaluation by calculating the fulfillment of the task of increasing labor productivity, output per worker and saving labor confirms the identity of the results. From the above data it is clear that the plan for increasing the labor productivity of one worker was fulfilled by 101% (11,158 / 11,051 · 100, or 105.4% / 104.4% · 100%).
The increase in labor productivity per worker was planned to be 4.4% (11,051 / 10,589 100 - 100, or 6053 / 5789 100 - 100).
The actual increase was 5.4% (11,158 / 10,589 · 100 - - 100, or 6,100 / 5,789 · 100 - 100).
The plan provided for an increase in production output by 2,774 million rubles compared to last year, including due to an increase in labor productivity by 2,679.6 million rubles. (462-5800), increase in the number of PPP - by 95.3 million rubles. (9 ? 10 589).
Consequently, due to the increase in labor productivity, it was planned to achieve an increase in production of 96.6% (2679.6 / 2774? ? 100). The actual increase in production amounted to 3274 million rubles. By increasing labor productivity, 3294 million rubles were received. (569 5789). The decrease in the number of PPPs reduced the increase in production by 21 million rubles. (2 10 589). Quantitative measurement of factors changing labor productivity is given in table. 11.4.
The analysis shows that the growth in labor productivity was achieved mainly through the technical re-equipment of production and the improvement of its organization. At the same time, the planned increase in labor productivity due to technical equipment turned out to be unfulfilled. Thus, as a result of the commissioning of new equipment, it was planned to increase the average annual output of one worker by 334 thousand rubles, i.e. by 3.16%, but in fact the increase was 2.2%, or 233 thousand rubles. Measures to reduce intra-shift downtime have not been implemented.
The influence of each of the factors under consideration on the overall increase in labor productivity is determined on the basis of the calculated relative savings in the number of industrial production personnel using the following formula:
where is the increase in labor productivity for each factor; - change in numbers as a result of the influence of certain groups of factors (±); EHR is the overall relative saving in the number of PPP.
We will make the calculations in the table. 11.5.
The increase in labor productivity due to technical measures provided for in the plan amounted to 91.3%, or 422 thousand rubles, in fact - 59.8%, or 340 thousand rubles; due to measures to improve management, organization of production and labor, according to the report - 82.6 compared to 50.6% according to the plan, which amounted to 469 and 234 thousand rubles, respectively. Due to changes in the structure of products, the planned share of the increase in labor productivity was exceeded by 18.6% (39.9-21.3).
Economic analysis of labor productivity using the described methodology provides a unified approach to determining the factors influencing its change. Calculation of factors for increasing labor productivity is carried out in accordance with measures to improve the technical and organizational level of production. At the same time, this methodology requires further improvement, primarily by ensuring a unified approach to calculating the relative savings of workers in terms of increasing the efficiency of the technical and organizational level of production and labor productivity.
In the context of the implementation of automated management systems, an objective necessity is the development of subsystems for the operational analysis of labor productivity. It should include:
monthly determination of the degree of implementation of the labor productivity plan;
monthly analysis of the use of intra-shift working time and determination of its impact on daily labor productivity, analysis of the implementation and quality of labor standards, identification of factors influencing the use of working time, compliance with standards, accumulation of information for analysis based on the results of work for the year;
Table 11.4. Analysis of labor productivity due to individual factors
| Factor | Calculation of labor productivity (increase +, decrease -) |
|||
| % | thousand rubles |
|||
| plan | actually | plan | actually |
|
| 1 | 2 | 3 | 4 | 5 |
| | 3,98 | 3,21 | 421 | 341 |
| Including due to: | | | | |
| Commissioning of new equipment | 3,16 | 2,19 | 335 | 233 |
| Equipment modernization | 0,48 | 0,43 | 51 | 47 |
| Technology improvements | 0,34 | 0,59 | 36 | 61 |
| Changes in natural conditions | -2,76 | -4,42 | -291 | -469 |
| | 0,93 | 2,14 | 98 | 226 |
| | 2,21 | 4,44 | 233 | 470 |
End of Table 11.4
Table 11.5. The share of influence of each group of factors on the growth of productive labor
| Factor | The share of each factor in the overall increase in labor productivity |
|||
| % | thousand rubles |
|||
| plan | report | plan | report | |
| Increasing the technical level of production | 91,3 = 100 | 59,8 = 100 | 422 = | 340 = |
| Improving the organization of production and labor | 50,6 = 100 | 82,6 = 100 | 234 = | 469 = |
| Changing the structure of products | 211,3 = 100 | 39,9 = 100 | 98 = | 227 = |
| Changes in natural conditions | -63,2 = - 100 | -82,3 = - 100 | -292 = | -467 = |
| Total due to all factors | 100,0 | 100,0 | 462,0 | 568,0 |
monthly analysis of factors changing labor productivity, as well as calculation of reserves for growth of labor productivity and an increase in output due to this factor.
The increase in output due to each organizational and technical factor is determined by multiplying the level of increase in the average annual output of one worker due to the i-th factor by the actual number of industrial production personnel. According to the table. 11.4, the increase in output due to each factor was:
As can be seen from the above data, the enterprise planned to increase the production of products, works and services at comparable prices due to organizational and technical measures, changes in the structure of products and other conditions by 2680 million rubles, in fact this increase amounted to 3288 million rubles. The increase occurred due to a decrease in the share of more labor-intensive products in its total output by 740 million rubles. (1308-568) and the introduction of organizational measures for 1370 million rubles. (2721-1351). However, failure to implement scientific and technological progress measures led to a decrease in production output against the plan by 468 million rubles. (1974-2442), and the actual increase in the labor intensity of production due to the deterioration of natural conditions reduced production output against the planned one by 1027 million rubles. (2715-1688). The change in the actual increase in production against the plan due to all factors was: 3288 - 2680 = 608 million rubles = - 468 + (-1027) + 740 + 1370 = 615 million rubles.
Analysis of reserves for increasing labor productivity is carried out by determining, according to the plan for the next year, a reduction in the labor intensity of manufactured products (in the context of individual types and for the enterprise as a whole). The initial data are given in table. 11.6.
Table 11.6. Reduction of working time costs, thousand hours
| Save time | Indicators | Change from plan |
|
| planned (reserves) | actual | ||
| Total | |||
| Including due to: | 346 | 461 | +115 |
| increasing the technical level of production | 82 | 33 | -49 |
| changes in product structure | 64 | 182 | +118 |
| improving the organization of production and labor | 200 | 246 | +46 |
| Of these, due to: | |||
| changes in the level of cooperative supplies | - | 35 | +35 |
| reduction of daily, intra-shift losses and non-production costs | 119 | 114 | -5 |
| expansion of service areas | 81 | 97 | +16 |
The influence of each factor on the change in labor productivity (in percentage) is determined by the formula
PT = Te / Tp
where Te is an increase (decrease) in working time savings compared to planned due to each technical and economic factor; Тп - time spent on production.
The ratio?PT(%), multiplied by the basic average annual output of the employee (BAP), shows its change (in rubles):
?PT = .
To carry out calculations for each factor, we present the initial data (Table 11.7).
To calculate these factors, we additionally use the overfulfillment of the plan for increasing annual production by industrial production personnel, which amounted to 1%, or 112.2 thousand rubles; production of the base (last) year - 10,589 thousand rubles; average number of employees: according to plan - 5800, according to the report - 5789 people. The time spent on implementing the program was planned at 10,800 thousand person-hours. Due to increased labor productivity, an increase in production of 649 million rubles was achieved. (112.2 · 5789) compared to 651 million rubles. (112.2 · 5800) according to plan, i.e. for 2 million rubles. less. The overall reduction in working time costs is indicated in table. 11.6. Data on the reduction in labor intensity are contained in the standards for labor intensity and calculations of its reduction. From those given in table. 11.7 data shows that at the analyzed enterprise, savings in working time were achieved mainly as a result of an increase in the share of cooperative deliveries and a reduction in lost working time.
Table 11.7. Analysis of factors for increasing the average annual output of a worker
and identifying opportunities to increase production output
| Labor productivity growth factor | Calculation of factors for changing the annual output of a worker (+) against the planned one | Calculation of the influence of individual factors on the volume of output (+), thousand rubles. |
|
| % | thousand rubles | ||
| Intensive: | |||
| Changing the structure of products | + 1.1 = +118 / 10,800 x x 100 | +116 = + 1,1 10 589 / / 100 | 5789 117 = + 678 |
| Change in the level of cooperative supplies | + 0.32 = + 35 / 10,800 x x 100 | + 0,34 = +0,33 10 589 / / 100 | 5789 35 = + 203 |
| Reducing labor intensity by increasing technical production | -0.05 = -49 / 10,800 x x 100 | -48 = -0,45 10 589 / / 100 | 5789 (-53) = -306 |
| Expansion of service areas | +0.15 = +16 / 10,800 x x 100 | +0,16 = +0,15 10 589 / / 100 | 5789 17 = +99 |
| Extensive: | |||
| Reduction of intra-shift, whole-day losses (absenteeism) and non-production costs of working time | -0.05 = -5 / 10,800 x x 100 | -5 = -0,05 10589 / / 100 | 5789 (-5) = -28 |
| Total | +1.06 = +115 / 10,800 x x 100 | 112,2 = 1,06 10 589 / / 100 | 5789 112,2 = +649 |
The planned saving of working time (346 thousand hours) was supposed to increase the average annual output of a worker by 3.2%, or by 339 rubles.
According to the report, time was reduced by 461 thousand hours. This increased the average annual output by 4.26%, or by 451 rubles. Hence, the increase in average annual output amounted to 112 rubles. (451-339).
The increase in labor productivity due to each factor is calculated in the same way.
The methodology for analyzing the factors of change in a worker’s output and their influence on the volume of production is given in Table. 11.7.
The analysis shows that factors such as changes in the structure of products, the level of cooperative supplies, and expansion of service areas had a decisive influence on the increase in the average annual output of workers and the volume of production. According to the established traditional methodology for analyzing the average annual output of one PPP employee, factors such as the share of workers in the total number of PPPs and the influence of indicators of the use of working time by one worker are also taken into account.
An analysis of the impact on the average annual output of the working share of workers in the total number of industrial production personnel and the average output of a worker is presented in Table. 11.8. According to the initial data given in table. 11.9, let’s calculate the impact of the share of workers in the total number of workers on the worker’s annual output.
Table 11.8. Analysis of the average annual output of a worker, taking into account the share of workers in the total number of employees, thousand rubles.
Table 11.9. Implementation of the labor plan
| Index | For the previous year | For the reporting year | In fact, % |
|||
| plan | actually | change against plan | to previous year | to plan | ||
| A | 1 | 2 | 3 | 4 | 5 | 6 |
| Volume of production accepted for calculating labor productivity, million rubles. | 73 332 | 76 715 | 77 468 | +753 | 105,6 | 101,0 |
| Average number of PPP | 8566 | 8696 | 8715 | +19 | 101,7 | 100,2 |
| Average number of workers | 6948 | 7235 | 7044 | -191 | 101,4 | 97,4 |
| Total number worked, thousand: | 1640,4 | 1740,7 | 1680,7 | - | 102,5 | 96,5 |
| man-days | 12 414,7 | 13 166,7 | 12 721,3 | - | 102,5 | 96,6 |
| man-hours | ||||||
| Average annual output, thousand rubles: working | 8561 | 8822 | 8889 | +67 | 103,8 | 100,8 |
| worker | 10 554 | 10 603 | 10 998 | +395 | 104,2 | 103,7 |
| Worker output, thousand rubles: hourly average | 5,907 | 5,826 | 6,089 | +0,263 | 103,1 | 104,5 |
| daily average | 44,70 | 44,07 | 46,09 | +2,02 | 103,1 | 104,6 |
| Average number of hours worked by workers: hours | 1786,8 | 1819,8 | 1806 | -13,8 | 101,1 | 99,2 |
| days | 236,1 | 240,6 | 238,6 | -2,0 | 101,1 | 99,2 |
| Average working day, hours | 7,567 | 7,564 | 7,569 | +0,005 | 100,0 | 100,1 |
The decisive influence on the increase in the average annual output of a worker was the increase in the average annual output of a worker by 326 thousand rubles. (9148-8822). Therefore, in the process of analysis, the factors of its change are determined and quantitatively measured (Table 11.10).
We find the impact on the hourly output of scientific and technical activities from the data of acts on their implementation. This reporting contains data on the number of relatively released workers. By multiplying these data by the worker’s planned average annual output, we find out how much production has increased.
Table 11.10. Analysis of the average annual output of a worker
Rational use of enterprise personnel is an indispensable condition for ensuring the uninterrupted production process and the successful implementation of production plans. For analysis purposes, all personnel should be divided into industrial and non-industrial personnel. To industrial production personnel (PPP) include persons engaged in labor operations related to the main activities of the enterprise, and non-industrial personnel include employees of cultural institutions, public catering, medicine, etc., owned by the enterprise.
Workers PPP are divided into workers and employees. The employees include managers, specialists and other employees (office accounting, etc. personnel). Workers are divided into main and auxiliary. In the analysis of the labor resources of an enterprise, one can distinguish three directions:
1. Analysis of labor use.
1.1. Analysis of the enterprise's supply of labor resources.
1.2. Analysis of personnel qualification level.
1.3. Analysis of forms, dynamics and reasons for personnel movement.
1.4. Analysis of working time use.
2. Analysis of labor productivity.
2.1. Analysis of the implementation of the plan for increasing labor productivity and determining the increase in production due to this factor.
2.2. Factor analysis of labor productivity.
2.3. Reserves for growth of labor productivity.
3. Analysis of remuneration.
3.1. Analysis of the composition and dynamics of the wage fund.
3.2. Factor analysis of the wage fund.
3.3. Analysis of the efficiency of using the wage fund.
Sources of information for analysis:
Labor plan, f No. 1-T “Labor report”, f No. 5-3 “Report on the costs of production and sales of products (works, services) of an enterprise (organization), statistical reporting of the personnel department on the movement of workers, etc.”
5.1. Labor Utilization Analysis
During the analysis of the supply of labor resources, a comparison is made of the actual number of personnel with the previous period and the planned number of the reporting period for all classification groups. The analysis process examines the relationship between groups and trends in this ratio.
The effect of changes in the share of main workers in their total number on the output of one worker is determined by the formula
Where UD 1, UD 0– the share of main workers in their total number according to the plan (base period) and report; NE 0– average annual output of one worker working according to plan.
The reduction of auxiliary workers can be achieved through the concentration and specialization of auxiliary work: setting up and repairing equipment, increasing the level of mechanization and improving the work of these workers.
Number of workers Ch r determined based on the norm of labor intensity of work for the planned period (T), effective (real) annual fund of working time (Tef) and the planned rate of compliance with standards TOnn according to the formula
 .
.
The number of workers employed in hardware and aggregate work, where the workers’ actions consist mainly of managing mechanized or automated processes, is determined by workplaces and service standards:
 ,
,
Where n i
– number of units in the i-th operation;
HPi– the number of workers required to service the i-th workplace;
kZi is the workload factor of workers at the i-th operation when their professions coincide;
i
– name of operations.
The number of employees is determined based on the organizational structure of the enterprise and the rational number necessary to ensure management functions.
The number of non-industrial personnel is determined according to standard industry standards and service standards.
Analysis of professional and qualification level of workers is made by comparing the available number by specialty and category with the number required to perform each type of work in sections, teams and the enterprise as a whole.
At the same time, a surplus or shortage of workers in each profession is revealed.
 ;
;
 ,
,
Where To assess the compliance of workers’ qualifications with the complexity of the work performed at a site, workshop, or enterprise, the average tariff categories of work and workers are compared, which can be determined using the weighted average arithmetic formula: T r
H- tariff category, p
H– total number (number) of workers,
pi
– number of workers of the i-th category,Vi R
– number of workers of the i-th category,
– volume of work of the i-th type,
If the actual average wage grade of workers is lower than the planned average wage grade of work, then this may lead to a decrease in the quality of products and, therefore, it is necessary to provide for staff training.
If the average category of workers is higher than the average tariff category of work, then workers need to make additional payments for using them in less skilled jobs.
During the analysis of the qualifications of management personnel, they check the compliance of the level of education of each employee with the position held, and study issues related to the selection of personnel, their training and advanced training.
The qualification level of workers depends largely on age, work experience, education, etc. Therefore, in the process of analysis, changes in the composition of workers by age, work experience, and education are studied. An important step in analyzing the use of personnel by an enterprise is to study labor movements
. The analysis is carried out over a number of years based on the following coefficients. (Table 14)
During the analysis, the reasons for the departure of workers for violation of labor discipline are carefully studied, since this is often associated with unresolved social problems. However, output depends not so much on the number of workers, but on the amount of labor spent on production, determined by the amount of working time. That's why analysis of working time use
is an important part of analytical work at the enterprise.
Table 14
|
Labor movement indicators |
Indicator name |
Formula for calculating the indicator |
|
Economic sense Reception turnover ratio (K n) Disposal turnover ratio (K in) Employee turnover rate (Kt) |
|
Personnel constancy coefficient (K post) Characterizes the share of hired employees for the period Characterizes the proportion of workers who left during the period Characterizes the level of employee dismissal for negative reasons |


Characterizes the level of employees constantly employed at a given enterprise in the analyzed period (year, quarter)
Analysis of the use of working time is carried out on the basis of the working time balance. The main components of the balance are presented in Table 15.
Table 15
|
Key indicators of the working time balance of one worker |
Time fund indicator |
Legend |
Calculation formula |
|
Notes Calendar Nominal (mode) |
Useful working time fund T nom =T to -t output T manifest =T nom -t implicit |
t out – time of weekends and holidays t no-show – days of absence: vacation, illness, by decision of the administration, absenteeism, etc. t – nominal working time, t vp – time of intra-shift downtime and breaks in work, reduced and preferential hours |
The complete use of labor resources can be assessed by the number of days and hours worked by one employee during the analyzed period of time, as well as by the degree of use of the working time fund. Such an analysis is carried out for each category of employees, for each production unit and for the enterprise as a whole.
The working time fund (WF) depends on the number of workers (N p), the number of working days worked per working day on average per year (D), the average working day (t):
|
|
If, in fact, one worker worked fewer days and hours than provided for by the plan, then it is possible to determine excess working time losses: all-day (D sweat) and intra-shift (t sweat):
During the analysis, it is necessary to identify the reasons for the formation of excess working time losses. These may include: additional leaves with the permission of the administration, absenteeism due to illness, absenteeism, downtime due to equipment malfunction, lack of work, raw materials, materials, fuel, energy, etc. Each type of loss must be assessed in detail, especially one that depends on the enterprise. Reducing the loss of working time for reasons depending on the workforce is a reserve for increasing production, which does not require additional capital investments and allows you to quickly get a return.
Having studied the loss of working time, unproductive labor costs are identified, which consist of working time costs as a result of manufacturing rejected products and correcting defects, as well as due to deviations from the technological process (additional working time costs). To determine unproductive losses of working time, data on losses from defects are used (magazine order No. 10). Based on these data, analytical table 16 is compiled.
Table 16
Initial data for calculating non-productive working hours
To calculate the unproductive costs of working time associated with the manufacture and correction of defects, determine:
· the share of wages of production workers in the production cost of marketable products:
 ;
;
· the amount of wages in the cost of the final marriage:
![]() ;
;
· the share of wages of production workers in the production cost of marketable products minus material costs:
 ;
;
· wages of workers to correct marriages:
![]() ;
;
· wages of workers in the final marriage and the costs of its correction:
![]() ;
;
average hourly wage of workers:
· working time spent on making defects and correcting them:
Reducing lost working time is one of the reserves for increasing production output.
![]() .
.
To calculate it, it is necessary to multiply the loss of working time (T sweat) due to the fault of the enterprise by the planned average hourly output (SV pl):
Losses of working time do not always lead to a decrease in the volume of production, since they can be compensated by increasing the intensity of workers' labor. Therefore, when analyzing the use of labor resources, great importance is attached to the study of labor productivity indicators.
5.2. Labor productivity analysis
To assess the level of labor productivity, a system of generalizing, specific and auxiliary indicators is used.
General indicators: average annual, average daily and average hourly production per worker, average annual output per worker in value terms.
Particular indicators: labor intensity of a certain type of product in physical terms per 1 man-day or man-hour.
Auxiliary indicators: time spent on performing a unit of a certain type of work or the amount of work performed per unit of time.
The most general indicator of labor productivity is the average annual output per worker (GW):
where TP is the volume of commercial products in value terms;
H – number of employees. Factors affecting annual output
are presented in Fig. 6.
Hence, the factor model for the average annual production indicator will have the following form:
where PDF i is the working time fund for the production of the i-th type of product,
VVP i – the number of products of the same name in physical terms.
This indicator is the inverse of the average hourly production. Reducing the labor intensity of products is the most important factor in increasing labor productivity. The increase in labor productivity occurs primarily due to a reduction in the labor intensity of products. It is possible to achieve a reduction in labor intensity through the implementation of measures NTP

Rice. 6. Interrelation of factors determining the average annual output of an enterprise employee
In the process of analysis, the dynamics of labor intensity, the implementation of the plan according to its level, the reasons for its changes and the impact on the level of labor productivity are studied. If possible, you should compare the specific labor intensity of products at other enterprises in the industry, which will allow you to identify best practices and develop measures for their implementation at the analyzed enterprise.
The analysis showed that the planned target for reducing the labor intensity of products for the enterprise as a whole was significantly exceeded. The target for reducing the labor intensity of products compared to last year was 95.3%, then the change was 95.3% -100% = -4.7%.
The actual reduction in labor intensity compared to last year is 90.97% or 90.97%-100%=-9.03%.
Example.
Table 17
Assessment of dynamics and implementation of the plan for the level of labor intensity of products
![]() .
.
Planned increase in labor productivity (hourly output) by reducing the labor intensity of products:
![]() .
.
Actual growth in labor productivity due to a decrease in labor intensity compared to last year:
The plan to reduce labor intensity was exceeded by 4.33% (95.3%-90.97%), as a result of which the average hourly output increased by 5.01% (9.92%-4.91%).
![]() ;
;
 ;
;
 .
.
Knowing how the average hourly output has changed, we can determine the change in the labor intensity of products: Conclusion.
There is an inversely proportional relationship between the labor intensity of products and the level of labor productivity. Therefore, the total specific labor intensity of production depends on the same factors as the average hourly output of workers.
|
|
In the process of subsequent analysis, indicators of specific labor intensity by type of product are studied. A change in the average level of specific labor intensity can occur due to changes in its level for individual types of products (TE i) and the structure of production (UD i). With an increase in the specific gravity of more labor-intensive products, its average level increases and vice versa:
 ;
;
 ;
;
 .
.
Changes in the level of labor intensity are not always assessed unambiguously. Labor intensity can increase with a significant share of newly developed products or with an improvement in their quality. To achieve improved quality, reliability and competitiveness of products, additional costs and labor are required. However, the gains from increased sales volumes and higher prices, as a rule, cover the losses from increased labor intensity of products. Therefore, the relationship between the labor intensity of a product and its quality, cost, sales volume and profit should be the focus of analysts’ attention.
At the end of the analysis, reserves for reducing the specific labor intensity of products are determined for individual products and for the enterprise as a whole:
 ,
,
where T f is the actual cost of working time for production, T n is the cost of working time associated with reducing labor intensity, T d is the additional cost of working time associated with the implementation of measures to reduce labor intensity. VP f – actual volume of gross output; VP n – the volume of gross output obtained in connection with a decrease in labor intensity.
5.3. Payroll analysis
The analysis of the use of the wage fund begins with the calculation of the absolute and relative deviation of its actual value from the planned one.
The absolute deviation is determined by comparing the funds actually used for wages (FZP f) with the planned wage fund (FZP pl) for the entire enterprise, production unit and categories of employees:
However, the absolute deviation is calculated without taking into account the degree of implementation of the production plan. Calculation of the relative deviation of the wage fund will help to take this factor into account.
To do this, the variable part of the wage fund (FZP per) is adjusted to the coefficient of fulfillment of the production plan (K pp).
The constant part of wages (FZP post) does not change with an increase or decrease in production volume - this is the wages of workers at tariff rates, the wages of employees at salaries, all types of additional payments, wages for workers in non-industrial production and the corresponding amount of vacation pay. Relative deviation of the wage fund:
In the process of subsequent analysis, the factors that caused absolute and relative deviations in the wage fund are determined.
The factor model of the variable part of the salary fund is presented in Fig. 7.

Fig.7. Scheme of the factor system of the variable wage fund
According to this scheme, the model will have the following form.
Similarly, we can imagine a factor model for the wage fund of employees.
During the analysis process it is also necessary establish the efficiency of fund use wages.
For expanded reproduction to obtain the necessary profits and profitability, it is necessary that the growth rate of labor productivity outstrip the growth rate of its payment. If this principle is not observed, then there is an overexpenditure of the wage fund, an increase in the cost of production and, accordingly, a decrease in the amount of profit.
The change in the average earnings of workers over the period is characterized by its index (J ZP):
The change in average annual output is determined similarly based on the labor productivity index (J pt):
The growth rate of labor productivity should outpace the growth rate of average wages. To do this, calculate the advance coefficient K op and analyze it in dynamics:
Then the amount of savings (overspending) is calculated. (E) wage fund due to changes in the relationship between the growth rate of labor productivity and its payment:
 .
.
In conditions of high inflation, when analyzing the average wage growth index, it is necessary to adjust the basic indicator of the average wage (SZ 0) to the index of growth in prices for consumer goods and services (J y)
 ,
,
where SZ 1 is the average salary in the reporting period.
Questions for self-control
1. In what main areas is the analysis of an enterprise’s labor resources carried out?
2. In what sequence and on the basis of what indicators is the analysis of the supply of labor resources carried out?
3. In what sequence and on the basis of what indicators is the analysis of the use of working time carried out?
4. What factors influence changes in the working time fund?
5. What indicators characterize labor productivity?
6. What factors influence the level of labor productivity?
7. In what sequence is the analysis of labor costs carried out?
8. Describe deterministic factor payroll systems.
9. List the techniques and methods used in analyzing the use of labor resources.
| Previous |